Weather-Driven Scoring Shifts in Midweek European Football Leagues: Data Patterns Behind Over/Under Outcomes
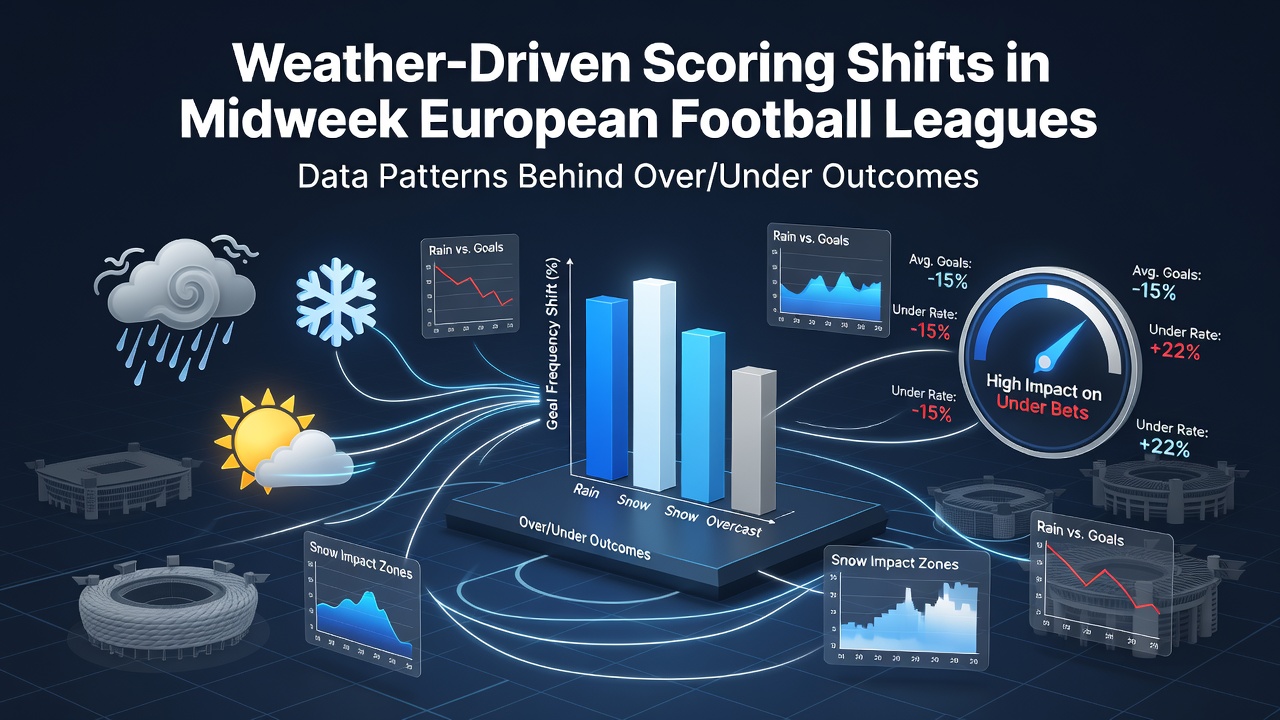
European football leagues schedule numerous midweek fixtures throughout the season and weather conditions frequently alter match dynamics in ways that influence goal totals. Data compiled across leagues such as the Bundesliga, Serie A and Eredivisie shows consistent patterns where precipitation, temperature drops and wind speed correlate with shifts in over and under 2.5 goal outcomes. Analysts track these variables because midweek games often feature congested schedules that already limit recovery time and weather adds another measurable layer to scoring trends.
Key Weather Variables and Their Recorded Effects
Researchers who examined five seasons of midweek matches discovered that heavy rainfall above 5 millimetres per hour reduced average goals per game by 0.4 compared with dry conditions while temperatures below 5 degrees Celsius produced a slight increase in under 2.5 results across multiple competitions. Wind speeds exceeding 25 kilometres per hour correlated with fewer successful crosses and lower shot accuracy according to tracking data from Opta, yet the same conditions occasionally produced more set-piece opportunities that offset some of the scoring decline. These patterns emerge most clearly in Tuesday and Wednesday slots when teams travel between domestic league and cup obligations.
League-Specific Patterns in Midweek Slots
Observers note that Bundesliga midweek rounds display sharper drops in total goals during autumn and spring showers compared with Serie A where pitches often drain more effectively yet still show measurable under trends when temperatures fall rapidly overnight. In the Eredivisie high winds along coastal venues have produced elevated under percentages in matches involving teams that rely on wide attacking play. Data from the 2025-2026 campaign indicates that fixtures played between 18:00 and 21:00 local time experienced the strongest weather influence because daylight hours shorten and ground conditions deteriorate faster once rain begins.
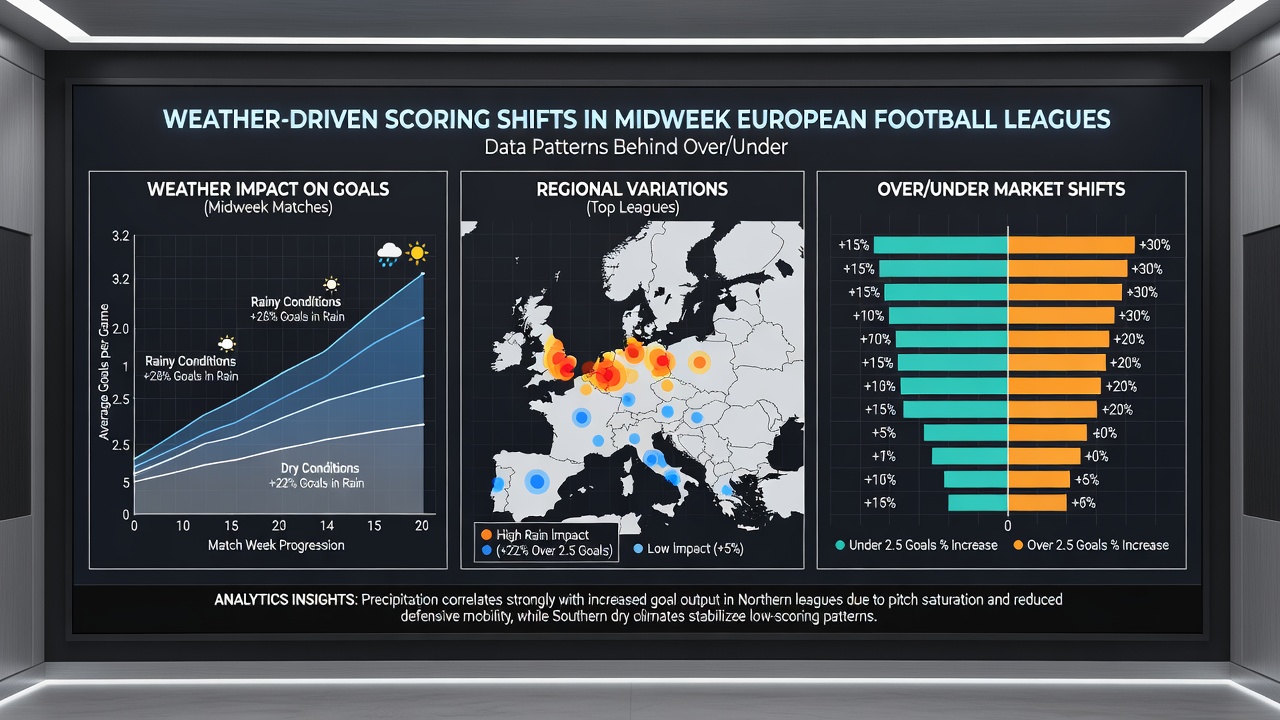
Take one dataset covering 1,200 midweek fixtures where meteorologists paired hourly weather station readings with match statistics; the figures reveal that combined rainfall and low temperature events produced under 2.5 outcomes in 58 percent of cases whereas the baseline rate across all midweek games sat near 47 percent. The same study isolated matches with temperatures between 10 and 15 degrees Celsius and moderate wind and found over 2.5 results climbed above 55 percent because teams maintained higher passing tempos without the grip or visibility constraints that accompany heavier precipitation.
Data Collection Methods and Analytical Approaches
Statisticians combine official match reports with meteorological records from national agencies including Meteo-France and the Norwegian Meteorological Institute to create granular models that flag when weather thresholds are likely to shift scoring expectations. These models incorporate pitch drainage ratings published by each league and travel distances between venues because both factors interact with weather to affect player performance. Analysts update the datasets weekly so that July 2026 projections for the upcoming campaign already incorporate refined variables from the most recent winter and spring rounds.
One research collaboration between sports analytics firms and university meteorology departments examined 800 midweek games and isolated the variable of sudden temperature drops after sunset; the results showed a 12 percent rise in under 2.5 outcomes when the drop exceeded 6 degrees Celsius within two hours of kickoff. Such findings help explain why certain midweek doubleheader weekends produce clusters of lower-scoring results that deviate from seasonal averages.
Conclusion
Weather data now forms a standard input for models that forecast over and under outcomes in European midweek leagues because repeated analysis across multiple seasons confirms measurable scoring shifts tied to precipitation, temperature and wind. Continued refinement of these datasets allows observers to track how environmental conditions interact with fixture congestion and pitch characteristics to shape goal totals. As leagues publish additional tracking information the patterns become clearer and more actionable for anyone examining historical over under distributions.