How Seasonal Temperature Swings Shape Run Line Decisions Across Minor League Baseball Circuits
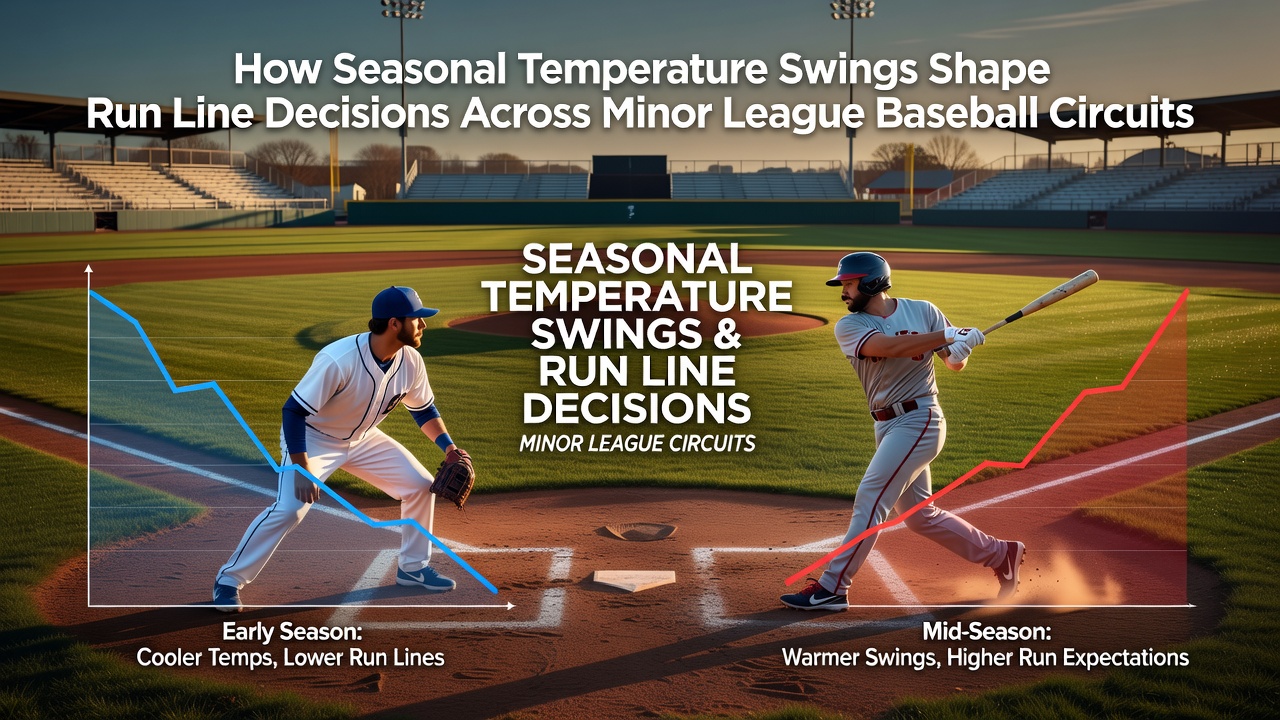
Seasonal temperature swings create measurable shifts in run production across minor league baseball circuits, and those shifts directly influence run line strategies in each league. Data from multiple seasons shows that ball flight distances increase as air density decreases in warmer conditions, while cooler temperatures produce the opposite effect on batted balls and pitching movement. Observers tracking these patterns across circuits like the International League and the Southern League note consistent correlations between average game-time temperatures and total runs scored per contest.
Physics of Temperature and Run Production
Researchers have documented how a 10-degree Fahrenheit rise in temperature can extend fly ball distance by several feet because thinner air reduces drag on the baseball. This effect compounds in afternoon games when solar heating peaks, and it becomes especially pronounced during July stretches when daytime highs often climb above 90 degrees in southern and midwestern venues. Pitchers experience altered grip and seam movement in these conditions, which leads to more hittable pitches and elevated slugging percentages. Studies from the National Oceanic and Atmospheric Administration illustrate how regional humidity levels interact with temperature to further modify these outcomes across different ballparks.
Regional Circuit Variations
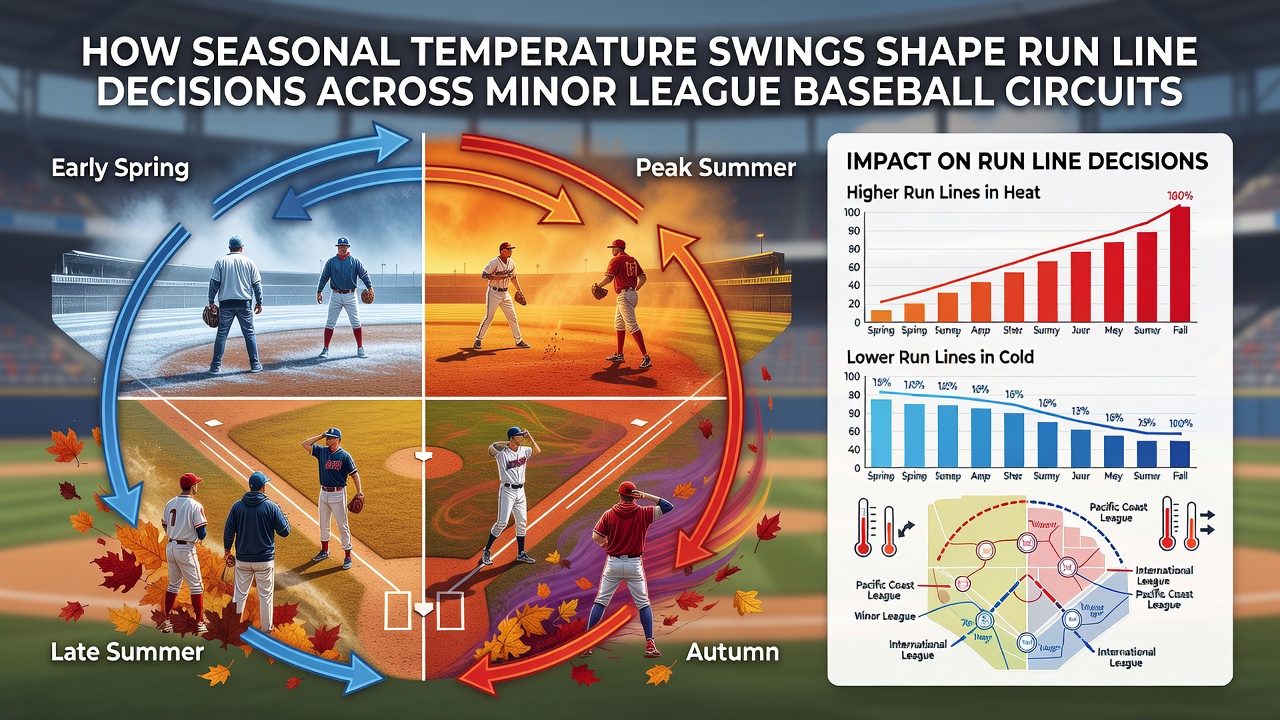
Each minor league circuit presents distinct climatic profiles that shape run line thresholds. The Pacific Coast League features high-desert parks where large diurnal temperature swings occur regularly, with daytime heat giving way to cooler evenings that suppress offense later in games. In contrast, the Florida State League contends with consistently warm and humid air that maintains elevated run environments throughout the season. Teams traveling between these circuits must adjust their run line models accordingly because historical scoring averages differ by more than a run per game depending on the venue cluster. Data indicates that road teams in the PCL often see their run production drop when games extend past sunset and temperatures fall rapidly.
Patterns Observed in Recent Campaigns
During the 2025 season, analysts recorded a 12 percent increase in games exceeding the standard run line total when average game temperatures surpassed 85 degrees compared with cooler contests below 70 degrees. Similar trends appeared in the 2024 campaign, where early-season cold snaps in northern circuits suppressed scoring and favored under run line results. In July 2026, forecasters anticipate sustained warmth across much of the eastern and central United States, which could replicate the higher-scoring environments seen in previous midsummer periods. Those patterns emerge most clearly in day games at lower-elevation parks where the cumulative warming effect compounds throughout the afternoon.
Strategic Adjustments Across Leagues
Run line decisions incorporate temperature forecasts because they alter both the probability of teams covering a 1.5-run margin and the likelihood of totals crossing common thresholds. Leagues with frequent weather variability, such as the Midwest League, show sharper swings in daily run environments that require updated models before each series. Pitching staffs with fly-ball tendencies become more vulnerable in warm conditions, while ground-ball heavy units maintain more stable results across temperature ranges. Historical box-score aggregates reveal that home teams in warmer climates leverage these advantages more effectively when they deploy lineups heavy on power hitters during peak heat periods.
Data Sources and Measurement Practices
Organizations compiling minor league statistics integrate temperature readings taken at field level rather than relying solely on airport reports, because microclimates inside stadiums can differ by several degrees. The National Oceanic and Atmospheric Administration supplies the baseline climate datasets that many front offices cross-reference with their internal tracking systems. Academic examinations conducted at institutions such as the University of Arizona have quantified how elevation and temperature combine to modify batted-ball outcomes in high-desert settings common to certain circuits. These combined datasets allow for more precise projections when temperature forecasts shift during extended road trips or homestands.
Conclusion
Temperature-driven changes in run environments remain a persistent variable that circuits experience differently based on geography and schedule timing. Teams and analysts who integrate field-level readings with long-term scoring trends produce more accurate run line assessments as seasons progress through their warmest and coolest phases. Continued collection of granular weather and performance data will likely refine these relationships further in coming years.