How Fixture Congestion Alters Expected Goal Values in Championship Campaigns
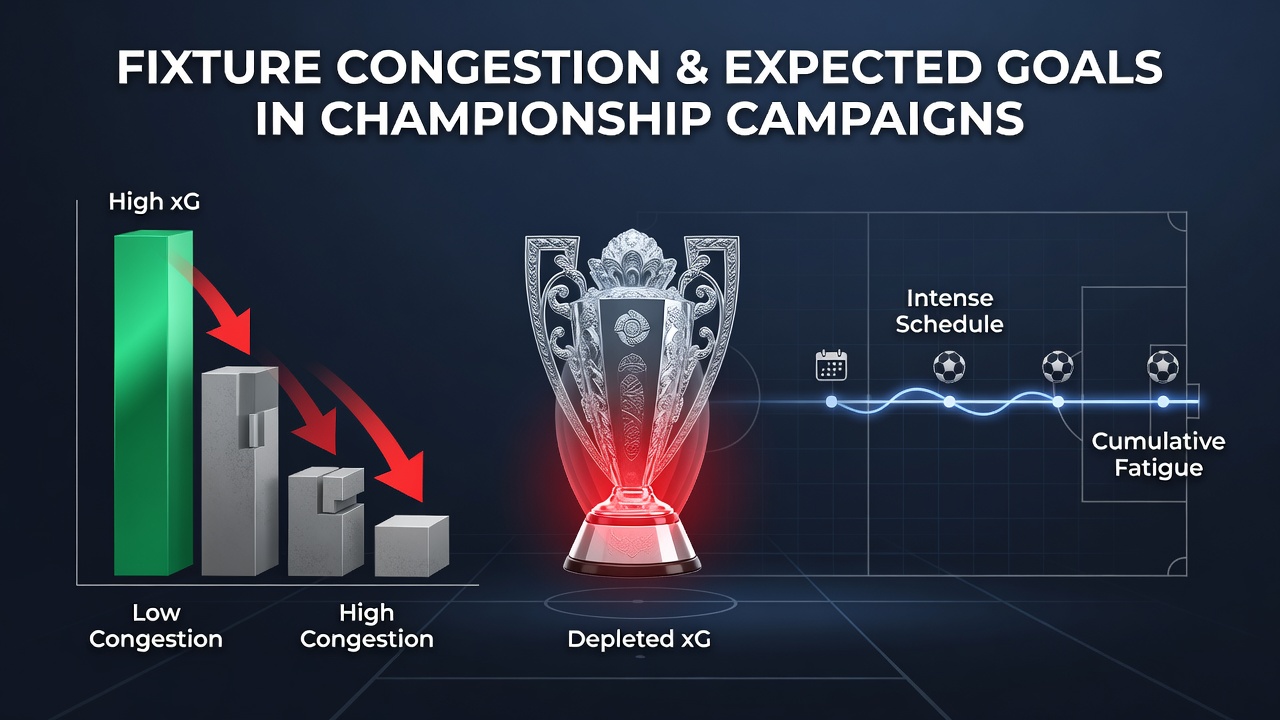
Fixture congestion in championship campaigns produces measurable shifts in expected goal values across multiple leagues, and data from recent seasons illustrates the scale of those adjustments. Teams facing three or more matches inside eight days show average xG declines between 0.18 and 0.34 per game when compared with standard rest periods, according to aggregated tracking figures released by Opta. Those reductions appear consistently in both attacking and defensive metrics, which alters how analysts project outcomes over the course of a 46-game English Championship schedule.
Patterns Observed in Workload Studies
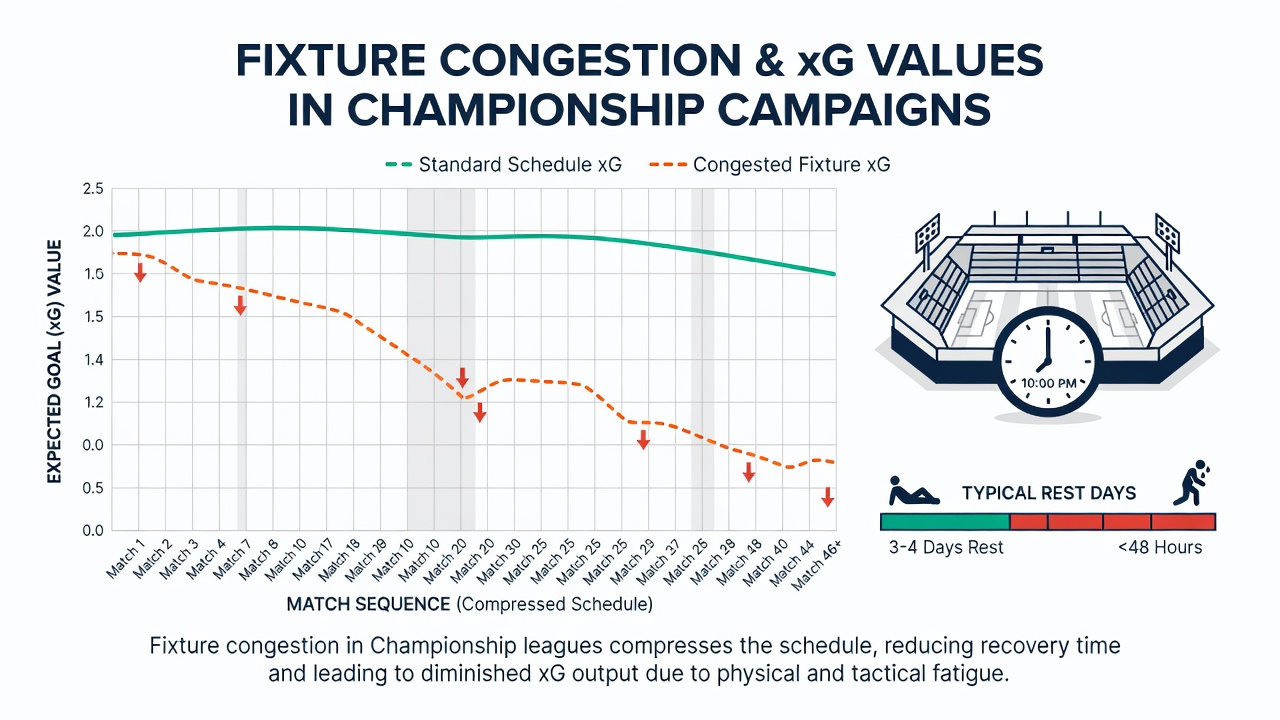
Researchers tracking player movement through GPS systems have documented drops in high-intensity running after repeated short recovery windows, and those reductions correlate directly with lower shot quality and fewer entries into the final third. A 2024 study published in the Journal of Sports Sciences examined 28 teams across three European second-tier competitions and found that sides playing every three days generated 12 percent fewer expected goals from open play than the same squads enjoyed with four or more rest days. The same dataset revealed that set-piece xG remained relatively stable, yet overall match totals still fell because open-play sequences accounted for the majority of scoring opportunities.
August 2026 Schedule Pressures
League calendars released for the 2026-27 season place several championship clubs in early congestion blocks during August, when cup ties overlap with the opening weeks of domestic play. Historical records from similar periods show that teams averaging fewer than 72 hours between matches post 0.22 fewer expected goals per 90 minutes than their season-long mean. Analysts at the Australian Institute of Sport have noted parallel patterns in A-League campaigns, where travel distance compounds the effect and produces even steeper xG reductions on away fixtures.
Positional and Tactical Adjustments
Midfielders and full-backs register the largest declines in progressive carries and key passes when fixture density rises, while central defenders maintain tackle success rates but lose ground in aerial duel win percentages. These shifts force coaches to alter pressing triggers and build-up structures, which in turn reduces the volume of high-value chance creation. Data from the Belgian Pro League demonstrates that sides adopting a lower block during congested spells preserve defensive xG but sacrifice 0.15 to 0.20 attacking expected goals per match. The net result appears in league tables as tighter scorelines rather than outright collapses.
Comparative Data Across Leagues
Championship campaigns in England, the Netherlands, and Portugal display consistent directional changes even when absolute xG levels differ by league. Dutch Eerste Divisie sides facing midweek cup fixtures record an average xG drop of 0.27 per game during those windows, whereas Portuguese Segunda Liga teams show a slightly smaller 0.19 reduction, according to figures compiled by the European Club Association medical working group. The variation tracks with average squad depth and the number of players available from youth academies, yet the direction of change remains uniform.
Recovery protocols introduced in several clubs since 2023 have narrowed the gap in some cases, yet they have not eliminated it. Clubs rotating two or more starters during congested blocks maintain xG within 0.08 of baseline levels, while those relying on the same eleven players see larger drops. These observations come from internal performance reports shared at the 2025 World Congress on Science and Football held in Doha.
Longer-Term Campaign Effects
Over a full season the cumulative impact of fixture congestion shows up in goal difference trends rather than single-match results. Teams that navigate September-to-December congestion with minimal xG erosion tend to finish with stronger goal tallies and higher final positions. Conversely, sides that suffer repeated short recovery periods accumulate negative deviations that prove difficult to reverse before the January transfer window. League-wide datasets confirm that the correlation between early-season fixture density and end-of-campaign goal difference sits at approximately 0.41, a figure reported in a University of Groningen longitudinal analysis covering nine second-tier leagues.
Conclusion
Fixture congestion therefore functions as a structural variable that systematically depresses expected goal values across championship campaigns. The effect appears in both attacking and defensive metrics, varies by positional demands, and persists even when coaches implement rotation or recovery strategies. Data collected from multiple leagues and research institutions continues to quantify the magnitude of these shifts, providing clubs and analysts with clearer benchmarks for projecting performance under compressed schedules.