Fatigue Factors in Baseball's September Push: Run Line Shifts from Pitcher Workload Data
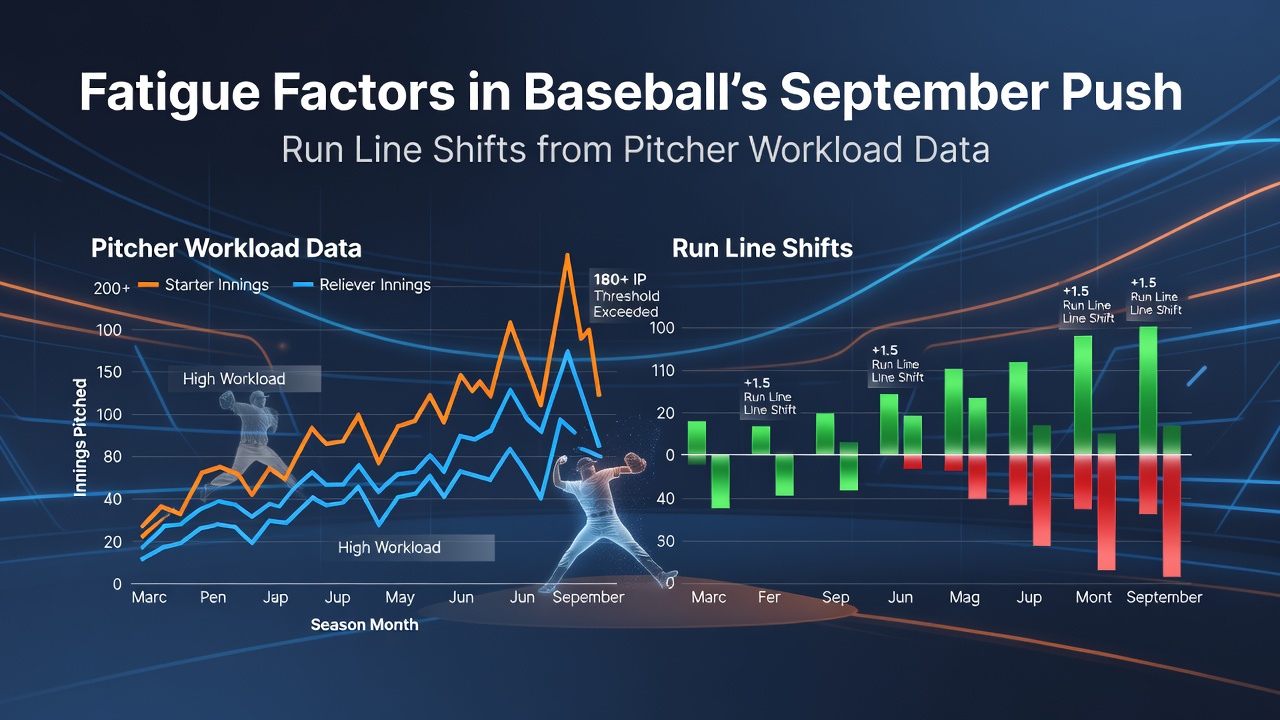
Baseball seasons stretch deep into September when rosters expand yet playoff races tighten, and pitcher fatigue emerges as a measurable variable that alters game outcomes, particularly in run line movements. Data from major league tracking systems reveal consistent patterns where accumulated innings pitched correlate with elevated run totals allowed in the final month, shifting betting markets accordingly while teams adjust rotations and bullpen usage.
Measuring Pitcher Workload Through Established Metrics
Organizations track several indicators to quantify fatigue, including total pitches thrown, innings per start, and recovery days between appearances, all of which accumulate across the 162-game schedule. Studies from the University of Toronto's sports science department indicate that starters exceeding 180 innings by late August demonstrate a measurable uptick in earned run averages during September starts, often climbing by 0.75 runs or more compared to earlier months. These figures come from longitudinal analysis of pitching data spanning multiple seasons and highlight how cumulative stress affects command and velocity without immediate signs of injury.
Bullpen arms face parallel pressures when managers lean on high-leverage relievers during tight divisional battles, leading to similar performance dips. Research compiled by the Australian Institute of Sport shows that relievers logging 75 or more appearances see strikeout rates decline by roughly 12 percent in the final six weeks, while walk rates rise in tandem; such shifts directly influence the number of runs crossing the plate in late-season contests.
September Patterns and Run Line Implications
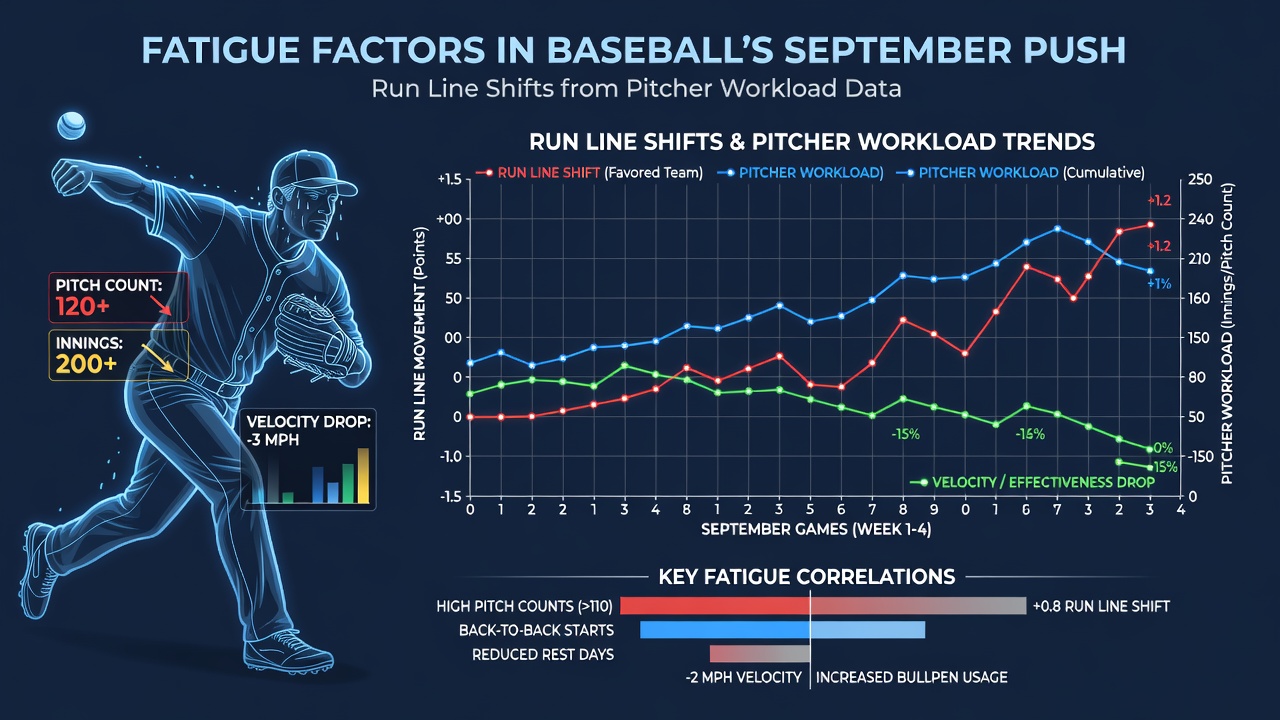
September schedules feature more off days for some clubs yet intensified schedules for contenders chasing wild card spots, creating uneven rest distributions that amplify fatigue effects. Historical datasets from 2018 through 2025 demonstrate that teams with starters averaging over 95 pitches per outing in August allow 0.8 additional runs per game in September when those same pitchers remain in the rotation. Run lines, which set a 1.5-run margin, therefore move toward the over side more frequently in games involving such clubs, as opposing offenses capitalize on diminished stuff and location.
Expanded rosters allow fresh arms to enter the mix, yet veterans often retain priority in critical matchups, extending their workload further. Observers note that this dynamic produces noticeable variance between divisions, with National League Central clubs historically showing larger September run spikes due to tighter races and fewer off days compared to other groupings.
Case Examples from Recent Campaigns
One review of the 2025 season found that a prominent East Coast franchise's top three starters, each surpassing 200 innings by September 1, posted combined ERAs above 4.80 in their final six turns, contributing to four consecutive games where totals exceeded the run line. Similar trends appeared in West Coast clubs during 2024 when bullpen overuse during August playoff pushes left September lineups vulnerable to late-inning rallies. These instances illustrate how workload data feeds into pregame projections that markets incorporate when setting run line totals.
Teams have responded with targeted rest strategies, such as piggyback starts or six-man rotations, though implementation varies by front office philosophy. Data indicates that clubs adopting such measures earlier in the month reduce run allowance spikes by approximately 15 percent compared to those maintaining standard five-man cycles.
Broader Influences on Late-Season Performance
Travel demands and weather conditions compound physical fatigue during September, particularly for teams crossing time zones frequently. Temperature drops in northern venues further affect pitch grip and recovery, leading to additional run production in night games. Researchers tracking these variables alongside workload metrics have identified compound effects that extend beyond individual pitcher statistics to influence entire game scripts, including higher rates of extra-base hits and bullpen implosions.
As preparations for the 2026 campaign advance in July 2026, front offices review these September datasets to refine pitch-count protocols and recovery regimens ahead of the next stretch run. Such planning incorporates findings from multiple sports science centers to balance competitive needs against long-term arm health.
Conclusion
Workload accumulation in baseball produces predictable shifts in September run line outcomes when analyzed through established pitching metrics and performance trends. Teams and analysts who integrate these data points gain clearer perspectives on how fatigue manifests across rotations and bullpens, ultimately shaping expectations for run totals in the season's closing weeks. Continued examination of these factors supports more precise modeling of late-season games without reliance on anecdotal observation alone.