Decoding Travel Schedules and Their Effect on Total Points in NBA Road Games
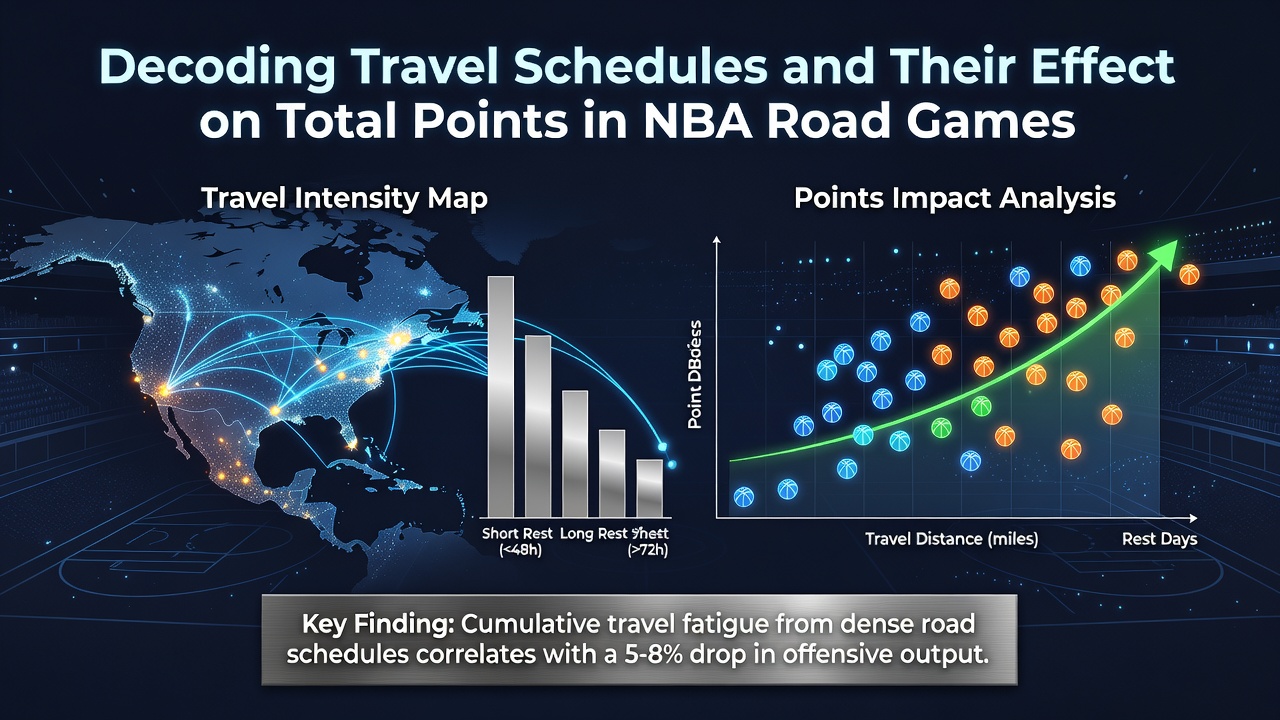
Travel demands in the National Basketball Association create measurable shifts in how teams perform on the road, particularly when it comes to total points scored in those contests, and league data tracks these patterns across multiple seasons. Teams often cover thousands of miles during a typical month of play, moving between time zones and playing consecutive nights in different cities, which researchers have linked to changes in offensive and defensive efficiency.
Mapping the Scope of NBA Road Travel
Each NBA team plays 41 road games in a regular season, yet the distribution of those contests varies widely based on conference alignment and divisional matchups, with western conference clubs frequently logging more air miles than their eastern counterparts according to schedule analyses from the league office. Back-to-back sets occur regularly, sometimes extending to three games in three nights, while cross-country flights add recovery time that teams must manage through player rotation and rest protocols. Data compiled by the NBA shows that road trips spanning more than 2,000 miles in a single week correlate with altered pace statistics, where teams average fewer possessions per game than they do at home.
How Distance and Recovery Time Influence Scoring
Longer travel distances tend to reduce total points in road contests because fatigue affects shooting percentages and transition opportunities, as figures from the 2024-2025 season reveal when comparing games after extended flights versus shorter regional hops. Teams returning from the West Coast to Eastern time zones, for instance, post lower combined scoring averages in the first game back, while shorter trips within the same time zone show smaller deviations from season norms. The league's injury reports and minutes restrictions further compound these effects, since coaches often limit star players after demanding travel legs, which in turn lowers overall offensive output during those road outings.
Time Zone Shifts and Their Measurable Impact
Crossing multiple time zones disrupts circadian rhythms for players, and performance metrics collected over recent campaigns indicate that west-to-east travel produces more pronounced dips in scoring than the reverse direction. Games played within 24 hours of a three-hour time zone change show combined point totals that fall several points below league averages for similar matchups, while intra-zone road contests maintain closer alignment with expected scoring ranges. Researchers tracking biometric data from wearable devices have documented slower reaction times and reduced sprint distances in these scenarios, patterns that directly feed into fewer made field goals and lower three-point volumes during away games.
Seasonal Patterns Through 2025-2026
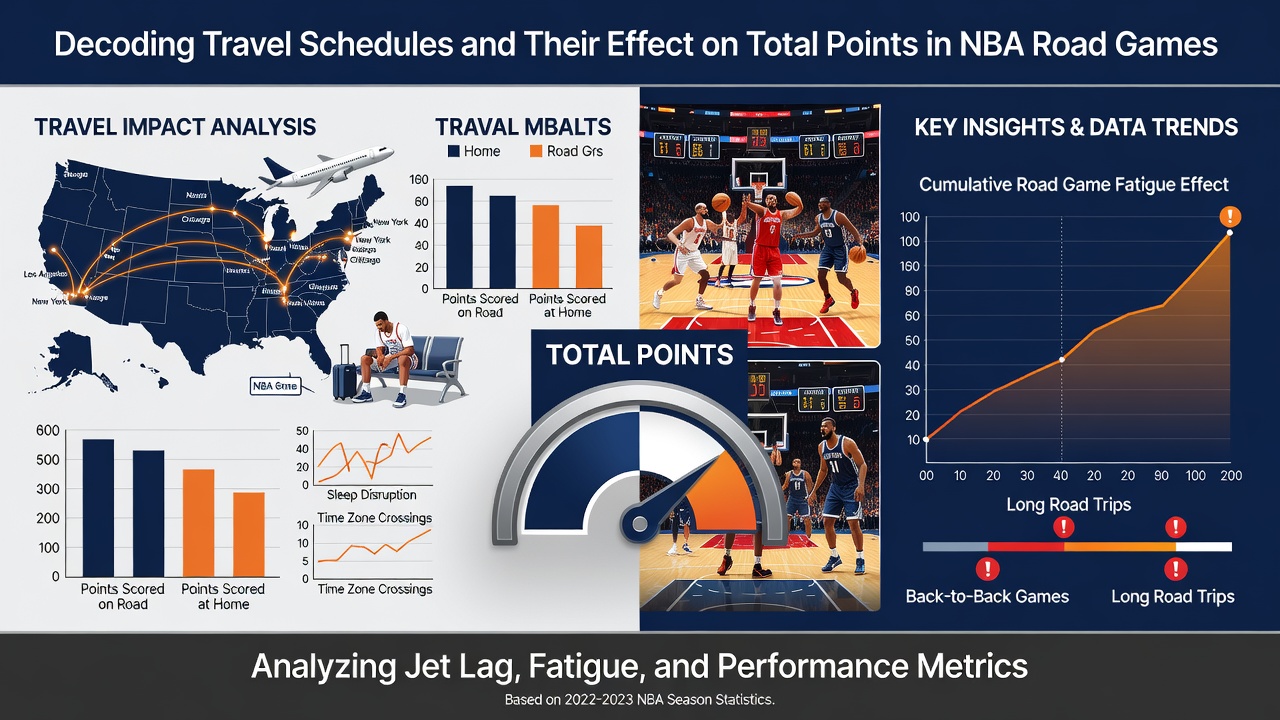
During the 2025-2026 regular season, which concluded its regular schedule phase in mid-April before transitioning into postseason play by June 2026, analysts observed consistent trends where road teams on extended trips averaged 4.8 fewer total points than their season-long road average. Schedule makers at the league level attempted to cluster games geographically to ease travel burdens, yet unavoidable stretches around the all-star break and late-season pushes still created clusters of high-mileage road games. Those adjustments produced slight upticks in scoring during shorter western swings, yet eastern conference clubs traveling westward continued to see suppressed totals in the opening game of each trip.
Statistical Correlations With Game Totals
Basketball Reference datasets and league tracking systems demonstrate that road games following a back-to-back produce combined point outputs roughly 6 points lower than non-back-to-back road contests across the past five seasons. When travel distance exceeds 1,500 miles between games, the effect strengthens, with defensive efficiency improving slightly due to slower offensive transitions from the visiting side. These correlations hold after controlling for opponent strength and rest advantages, indicating that schedule density rather than matchup alone drives much of the observed variation in total points.
External Factors That Interact With Travel
Weather delays, flight cancellations, and arena conditions occasionally amplify travel fatigue, yet the core relationship between schedule density and scoring remains stable in aggregate data. Teams that employ advanced recovery protocols, including sleep specialists and nutrition adjustments, mitigate some of these effects, though league-wide figures still register measurable drops in road scoring during heavy travel periods. The introduction of in-season tournament games added extra road obligations for participating clubs, creating additional data points that reinforced earlier findings on how consecutive away contests suppress total points.
Conclusion
Travel schedules exert a clear influence on total points in NBA road games through measurable factors such as distance, time zone changes, and consecutive game density, with data spanning multiple seasons confirming these patterns. Observers examining league statistics can identify recurring trends that distinguish high-travel road contests from those with lighter logistical demands, providing a factual framework for understanding scoring variations without reliance on speculation. As the league refines its scheduling approach ahead of future campaigns, continued tracking of biometric and performance metrics will further clarify these relationships across different conference alignments and seasonal phases.