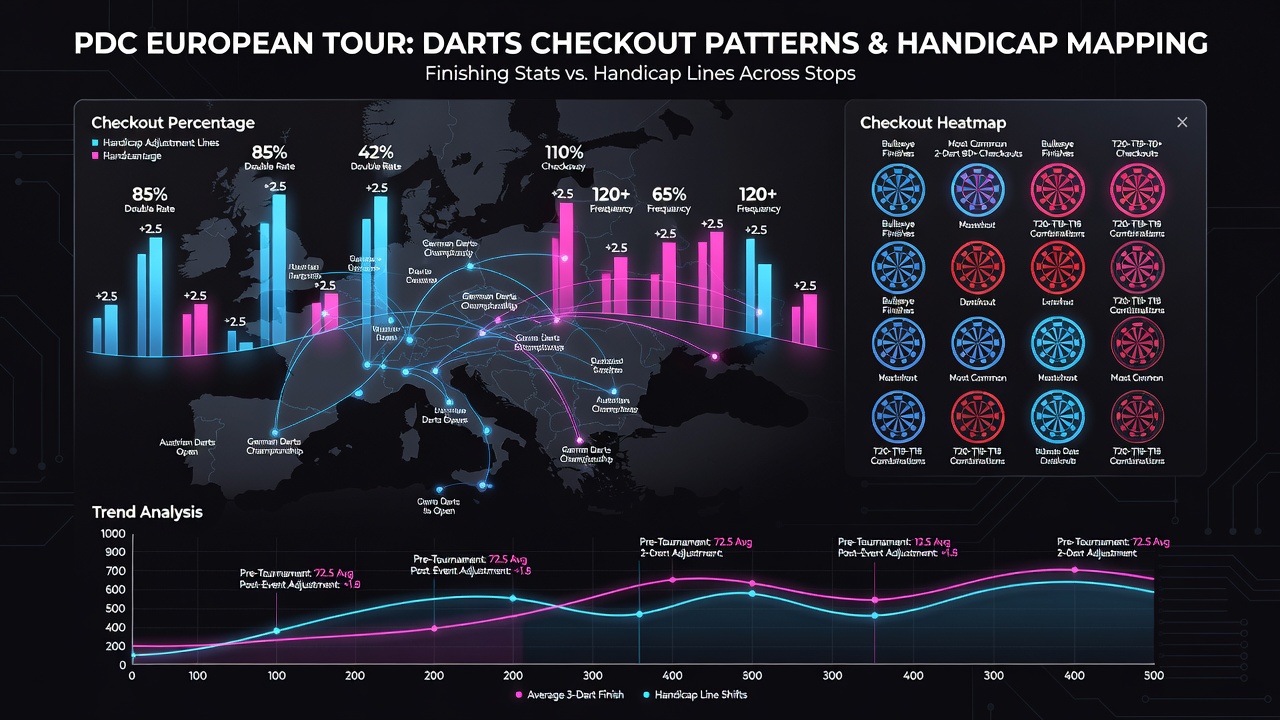
Darts Checkout Patterns in PDC Events: Mapping Finishing Stats to Handicap Lines Across European Tour Stops
Data from PDC European Tour events shows distinct checkout patterns that analysts track when evaluating handicap lines, and these finishing sequences often align with specific leg margins across multiple stops. Researchers compiling statistics from venues in Germany, Austria, and the Netherlands have noted that players completing legs on 170, 167, or 161 occur at measurable rates depending on teh stage of the tournament, while lower checkouts like 81 or 60 appear more frequently in early rounds where averages dip below 95.
Checkout Frequency Across Recent Seasons
PDC records indicate that the most common checkout in European Tour matches remains 81, followed closely by sequences ending on 60 and 100, yet the distribution shifts when events move into quarterfinal stages where higher finishing percentages emerge. Observers note that players maintain an average checkout success rate above 35 percent on attempts at 100 or more during the 2025 season, and this figure rises further in venues such as the Eissporthalle in Riesa where crowd energy correlates with sustained scoring runs. Mapping these figures to handicap lines involves comparing a player's historical finishing percentage against an opponent's, which creates spread opportunities when one competitor demonstrates a 10 percent edge in closing legs above 140.
European Tour Stops and Regional Variations
Events on the European Tour circuit, including the German Darts Grand Prix in Hildesheim and the Austrian Darts Open in Vienna, produce consistent data sets that highlight how travel and scheduling affect checkout accuracy. Figures reveal that participants who compete in consecutive weekends across borders show a slight decline in checkout percentages on doubles after the third match of a week, while those with rest periods maintain steadier rates around 38 percent. In August 2026 the schedule includes stops in Hungary and Belgium where similar patterns are expected based on prior years, allowing handicappers to adjust lines when early-round data from these locations becomes available.
Linking Stats to Handicap Adjustments
Analysts at sports data firms connect checkout distributions directly to handicap calculations by examining leg-win probabilities derived from finishing attempts. For instance, when a player records checkouts on 140 or higher in more than 22 percent of legs during group stages, betting markets often respond by tightening spreads against opponents whose closing rates fall below 30 percent overall. Data compiled through 2025 demonstrates that such adjustments frequently result in handicap lines moving by half a leg or more once preliminary rounds conclude, and European Tour organizers release updated player averages that feed these recalibrations.
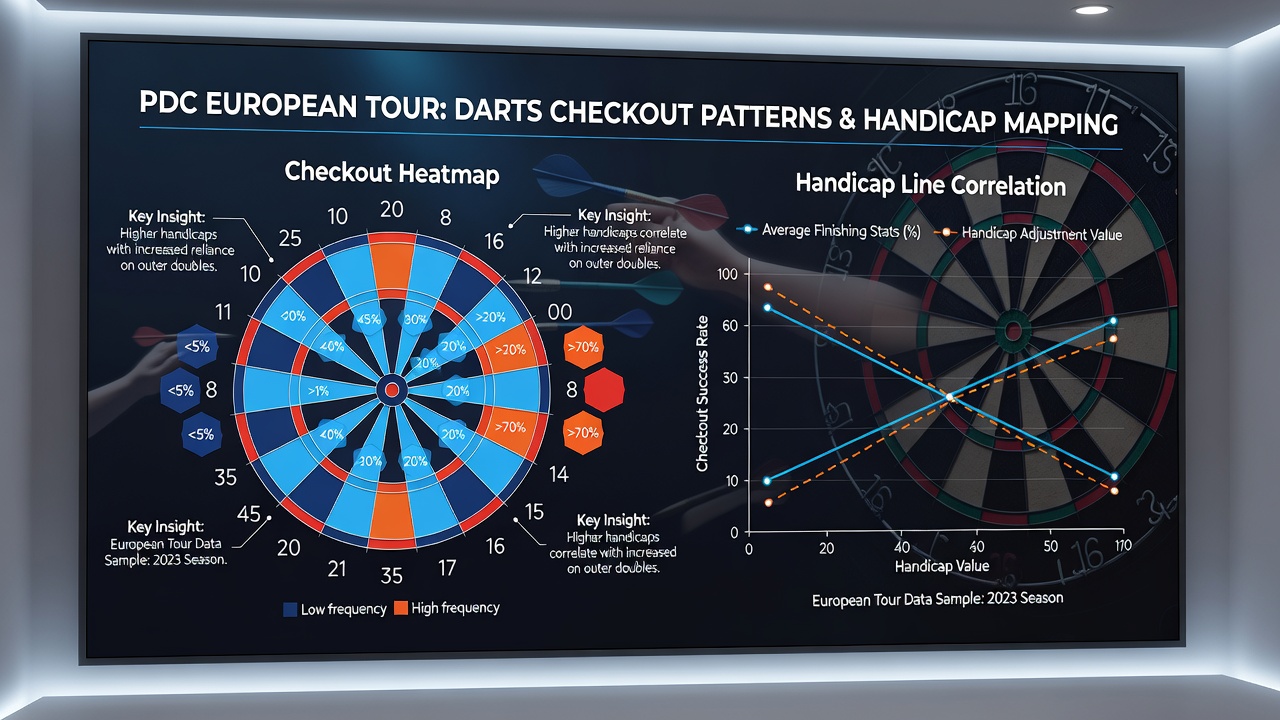
One study conducted by researchers at a Dutch sports analytics institute examined 1,200 legs from the 2024 European Tour and found that matches featuring at least four checkouts above 121 produced wider final margins on average than those dominated by finishes under 80. This information helps frame handicap offerings because it quantifies how finishing strength translates into leg differentials across best-of-11 or best-of-13 formats common at these stops.
Player-Specific Finishing Profiles
Individual profiles illustrate the mapping process clearly. Players who average 100 or more points per turn display checkout rates on 170 that exceed the field average by roughly 4 percentage points, according to aggregated PDC figures, and this edge appears most pronounced at venues in the Czech Republic and Poland. Conversely, competitors whose three-dart averages sit between 85 and 92 rely more heavily on 60 and 81 finishes, which influences how markets set spreads when these participants face higher-ranked opponents. Tournament data from the 2025 German Darts Championship revealed that underdogs closing at least 32 percent of their attempts on doubles managed to cover certain handicap lines despite lower overall scoring.
Data Sources and Analytical Methods
Statistics drawn from official PDC scorecards and cross-referenced with reports issued by the European Gaming and Betting Association provide the foundation for these mappings. Additional context comes from performance reviews published through Canadian sports research networks that track international darts trends, allowing comparisons across continents. These sources combine leg-by-leg breakdowns with venue-specific variables such as board lighting and travel distances, which analysts then apply when projecting handicap outcomes at upcoming events.
Conclusion
Checkout patterns in PDC European Tour events supply measurable inputs for handicap line construction, and ongoing collection of finishing statistics continues to refine how those lines shift from round to round. Data across multiple seasons demonstrates consistent relationships between high-percentage doubles and leg margins, while regional stops introduce predictable variations tied to scheduling and player rest. As the 2026 calendar progresses, updated profiles will further clarify these connections for observers tracking the sport's statistical landscape.